During each month we randomly a sample of customers who have called in to complete a survey on the quality of the support they have received. The feedback and results received help us to identify areas for improvement and training within the Customer Support Centre (CSC). This month we sent out 3009 surveys and received nearly 10% of those back completed. This means that 0.7% of all customers that contacted the CSC during June gave us feedback on the support levels. It's important for us to highlight these figures to allow the results shown to be taken in context. Right, on we go with the graphs. Nature Of Call First up this month is the Nature of Call graph, this simply shows the types of calls we are receiving into the CSC over the course of a month. The graph shows that the amount of faults calls has reduced which could well be due to the dedicated faults team who were recently introduced. The amount of sales calls has increased which can only be a good thing.  Call Wait Time It doesn't matter what you are calling about, you want the phone answered quickly all the time. The Call Wait Time graph shows that the more of you are having to wait 5 minutes or more compared to previous months. This isn't the way we want the graph to look so we'll be working hard to get this improved next month.
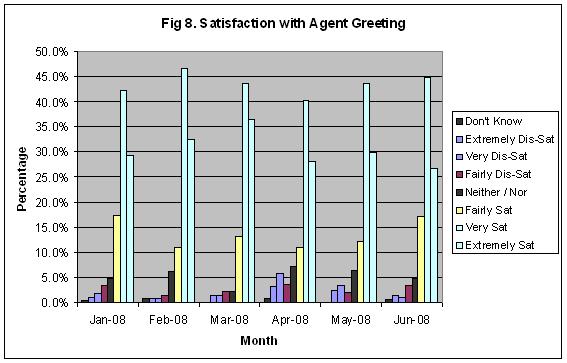
 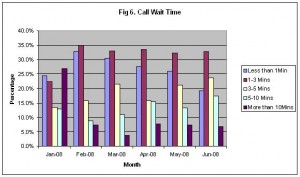 Agent Greeting If you've been waiting 5 seconds or 5 minutes the first thing you hear when we answer the phone is the greeting from the CSC agent, often this can set the tone for the whole call. A very high number of you are satisfied or higher with the greeting you receive when you call us, with the positives outweighing the negatives by a large amount.
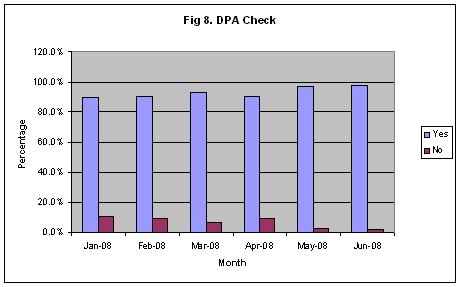
  DPA Check Are you who you say you are? Well that's our job to find out at the start of the call. This graph is showing continued improvement month to month on this, with less than 2.5% stating that they didn't have a DPA (data protection) check.
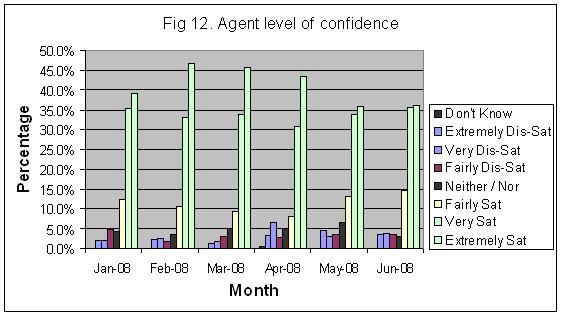
 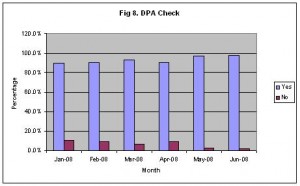 Agent Confidence If we are confident in the answers we are giving you, then you'll be more confident that we are giving you the correct information. Once again this is an area we are excelling in with the amount of satisfieds far outnumbering the dissatisfied results.
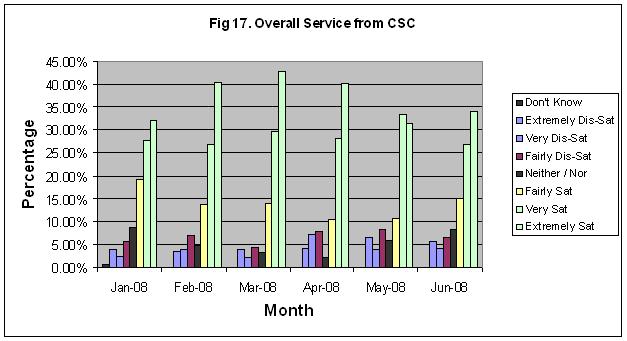
 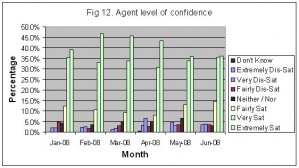 Overall Service So how did we perform? On the whole you can see the results are in the positive, however this doesn't mean that we are sitting back and resting. There are always areas for improvement and we are continuing to look into any aspects of the service we can improve on.
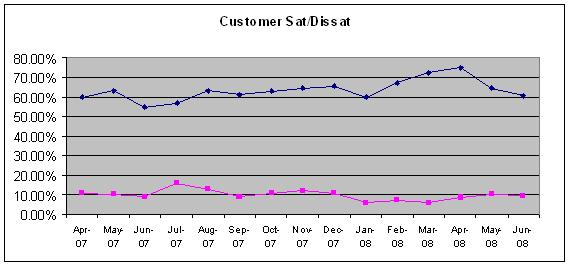
  Overall Service Trend Following the trend graph from previous months, here is the updated version showing the customer satisfaction and dissatisfaction figures for the month.
 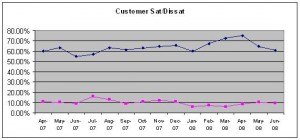 As always, thanks for reading and I'll be back soon with more results. Chris.