Turn on suggestions
Auto-suggest helps you quickly narrow down your search results by suggesting possible matches as you type.
Showing results for
Broadband Faults Guide - Our Testing
Broadband Faults Guide - Our Testing
Topic Options
- Subscribe to RSS Feed
- Mark as New
- Mark as Read
- Bookmark
- Subscribe
- Printer Friendly Page
- Report to Moderator
- Plusnet Community
- :
- Library
- :
- Broadband Faults Guide - Our Testing
Broadband Faults Guide - Our Testing
07-11-2013
9:39 PM
When you raise a fault with us, you will notice that when a member of the Faults Team tests your line, that testing is displayed on the fault ticket you have raised. I will give examples of ADSL and ADSL2 testing, all with an explanation of what the testing means and how we conclude our findings.
20CN (Up to 6Mb) testing results
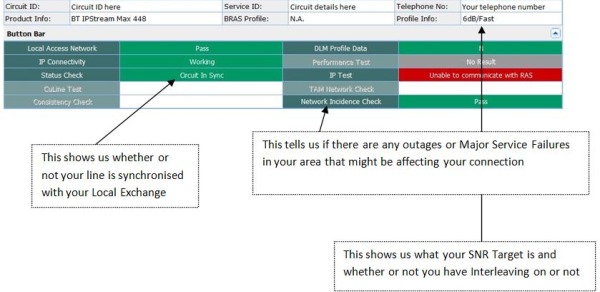
The testing program we use is called KBD (Knowledge Based Diagnostics). Please see the below image which is annotated with explanations.
So the above really covers whether or not you are connected to the exchange (in sync), what your SNR is targeted at, whether you have interleaving on or not as well as the Network Incidence Check. This shows us, at a glance what state your connection is in. In this example, we can see the line is connected to the exchange fine, but the End User/Customer does not appear to have set their router up or is having problems connecting with their details or, the connection has dropped out as part of a Dropping Connection Fault.
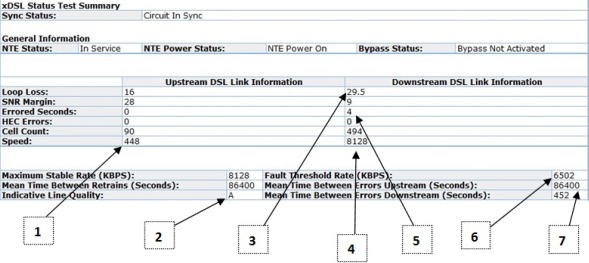
Next, we’re going to look at a Status Check. This gives us details on what the rate you are connected to the exchange is and whether or not your line is erroring that might cause you a few problems. Please see the below example:

- Shows the connection rate between your router and your Local Exchange (Sync Rate) of your upload speed
- Shows your Indicative Line Quality (please continue reading for more information on this) which is currently showing as ‘Amber’
- Loop Loss, this indicates your line attenuation, we can base your sync rate on this normally
- Your current sync rate between your router and Local Exchange
- This is the number of errors this line has generated (please continue reading for more information on this)
- Shows what the minimum speed your line should operate at, this is set automatically after your line has finished the initial 10 day training period
- Shows how often your line is generating errors (measured in seconds – 86400 is the maximum within a 24 hour period)
How do we analyse this information?
Depending on the type of fault raised will depend on how we analyse the information. Assuming this was raised as a No Sync fault, we would give you a call to advise that we can see a connection on our end – we can troubleshoot with you over the phone what the problem is and get the router set up in most instances.This particular example was raised as a Speed Fault. The first thing to note is that we are seeing your line synchronising at the maximum speed of 8128Kbps (on 20CN). If you scroll back up to the first image, you’ll see ‘Performance Test’ – this hasn’t been completed. As this is the case, as far as we can see, the connection rate is fine; this is likely a throughput issue. To investigate this further, we need some evidence to support the problems you are seeing.
The line is erroring which is a slight cause for concern; however, with very few errors on the line, it is very unlikely to be impacting the service. I would usually say that errors over the 50/60 mark would be something we look seriously at as potentially causing a problem. Errors on the up/downstream can more often than not indicate a Telephone Fault.
Meantime between Errors is what we use to judge how often a line is generating errors. If you see 86400, this means that your line is not generating any errors. If you see 200, it means your line is generating an error once every 200 seconds. 86400 is the total amount of seconds in a 24 hour period, therefore no errors are being generated.
That said, there are still errors on the line. This shows to me that the data is not in date and is not valid. In these instances, we would request that you complete the BT Speedtester to provide us with more information on the problem you are having.
I will show a snapshot of the results we use for a Copper Line Test:

You can see the Status: has passed – therefore, no fault has been found with the service. MFL stands for Main Fault Location – if a fault was detected, we can see what part of the broadband network the fault was detected on. We are provided with details of your line length, Distribution Point length (estimated).
21CN (Up to 16Mb) testing results
The results for 21CN are really quite similar, such as the Copper Line Test, so I will refer to previous images to prevent duplication.

- Shows the amount of errors detected on the upstream
- Shows the connection rate between your router and your Local Exchange (Sync Rate) of your upload speed
- Shows your SNR (Signal to Noise Ratio)
- Shows your downstream connection rate between your router and Local Exchange (Sync Rate)
- Shows the amount of errors detected on your line on the downstream
As you can see, there are errors on both the upstream and downstream; however there is no fault with the service. This proves that having a low amount of errors on your line does not always dictate whether or not you have a fault. Given the length of the line (Loop Loss: 43.5 – measured again this graph) shows that the sync speed is actually much better than we would expect.
If we were to raise the SNR Target from 6db to 9db, this would likely remove the errors from the downstream. Applying Interleaving to this line would more than likely clear up the errors on the upstream and downstream. As the line is working perfectly fine as it is, there’s really no need to make any changes to the line.
FTTC (Up to 76Mb) testing results

Indicative Line Quality

As you can see there are seven different types of line quality. Please see explanations below:
Black – Your line will likely fall under this bracket when your connection has only just come online. Black is used when not enough data has been captured to provide you with an ILQ.
Grey – Again, this is when not enough data has yet been captured to assign an ILQ.
Scarlet – This is assigned to a line when the line has been consistently retraining (losing connection to the Local Exchange). If you see the ‘Mean Time Between Retrains’ (MTBR) from the 20CN Status Check above, you will see the figure is 86400 – if this figure was lower than 10, the line will get an ILQ of Scarlet. If this does happen, negative changes will be made by DLM, such as, banding.
Crimson – Very similar to Scarlet, however, Crimson is if the Mean Time Between Errors (MTBE) on the upstream falls below 10 rather than the 86400 we would like to see, the ILQ will change.
Red – This is one of the more common ILQ values that we see when investigating faults. Red indicates that the downstream Mean Time Between Errors (perfectly would be 86400) has fallen below 10, as well as that, the Mean Time Between Retrains has fallen below 8640. Negative changes will be made to by DLM to try and increase the MTBE/MTBR values by banding the line.
Amber – The line will fall into an ILQ of Amber if your MTBE falls between 420 -10 and/or your MTBR is between 16800-8640. As the line, in this condition isn’t all that bad, no negative or positive changes will be made to the line. If the MTBE/MTBR reduces/improves further, the ILQ will change accordingly.
Green – The line must be of a very good standard for the ILQ to be green. The MTBE should be MTBE > 420 with an MTBR > 16800. If the ILQ is green, positive changes will be made to the DLM, such as, reducing the SNR and SNR Target to get more out of your line. Any line banding (that isn’t chronic) will be removed to give you the full speeds your line is capable of achieving.
The testing is only for internal purposes; however you are able to view it once our Faults Team has completed their testing. Engineer notes (after a visit) will also be displayed upon retesting. If you have any questions on your open fault specifically, it’s always best to add a comment to your support ticket – only add notes if absolutely necessary.
0
Comments
16073
Views
