Plusnet Speed Distribution - July 2009
- Subscribe to RSS Feed
- Mark as New
- Mark as Read
- Bookmark
- Subscribe
- Printer Friendly Page
- Report to Moderator
- Plusnet Community
- :
- Plusnet Blogs
- :
- Plusnet Speed Distribution - July 2009
Plusnet Speed Distribution - July 2009
Last year we published the distribution of our customers speeds in order to compare what our customers were starting to see on our 21CN network against what they previously had and also to see what speed distributions both 20CN and 21CN were giving. As we have over 800 customers on 21CN now we thought it would be useful to revisit the distribution of speeds as we have a much better sample size now.
The speeds we are using in all the figures and graphs here are taken from the delta reports we receive from BT Wholesale which show the BRAS speed rate. The sync rates will therefore be higher than these speeds. We have excluded our LLU base from the data because we don't have the same reporting on the speeds. Unless otherwise noted we have also excluded customers on fixed rate 512kbps, 1Mbps and 2Mbps products. We should note that there are a small number showing as (blank) where we don't know where the speed is, these will mainly be new activations where the customer hasn't connected yet or where we've never received a delta report (which will mainly be stable lines at the maximum sync rate).
Note: check our handy guide to understand what is a good broadband speed.
Starting off with 21CN, the mean speed comes out at 6533Kbps. Below is the distribution of the speeds across all of our triallists.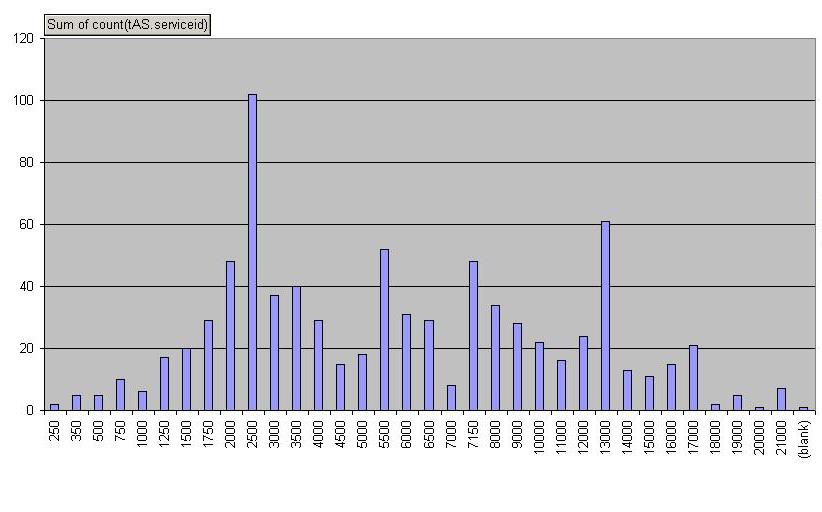
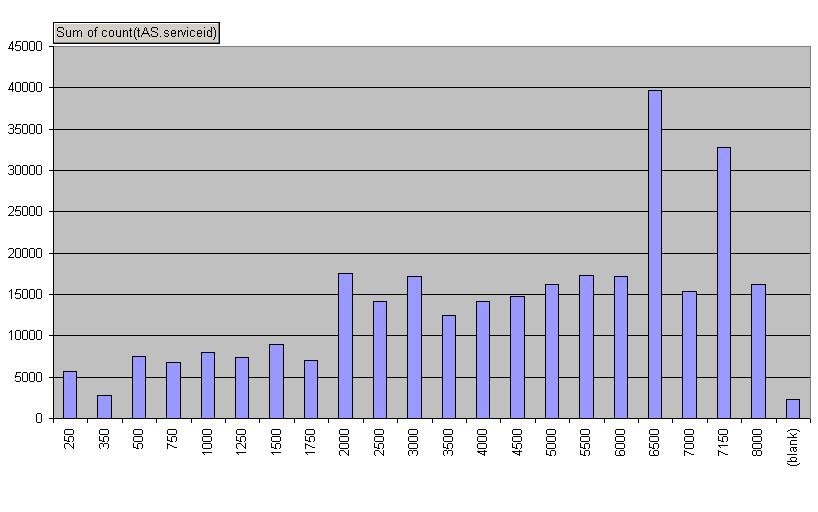
For 20CN, the mean speed is 4520Kbps, so taken on average 21CN is certainly offering faster speeds, although of course a lot of the big gainers are those living very close to the exchange.
Below is the distribution of speeds for our 20CN customers.
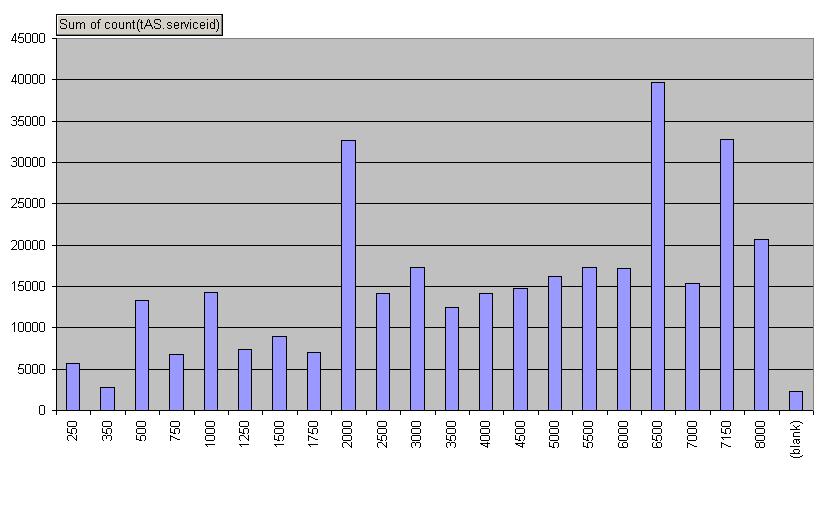
If you include those on fixed rate speeds it looks like this, about 15% of our customers are on fixed rate speeds.
The UK broadband market has been split up by Ofcom into three distinct market areas (four if you include Hull). Each exchange in the UK is determined to be within one of three markets depending on how many wholesale suppliers operate there. Four or more suppliers make it a market 3 exchange, two or three supplier make it a market 2, and only one make it a market 1 exchange. Generally the market 3 exchanges are located in the more urban areas where there are bigger exchanges with more customers while the market 1 exchanges tend more to be the more rural exchanges that serve a small number of customers. There are of course exceptions, but it's interesting to look at the split of speeds by market to see if there are any difference. This graph shows the speed distributed by market.
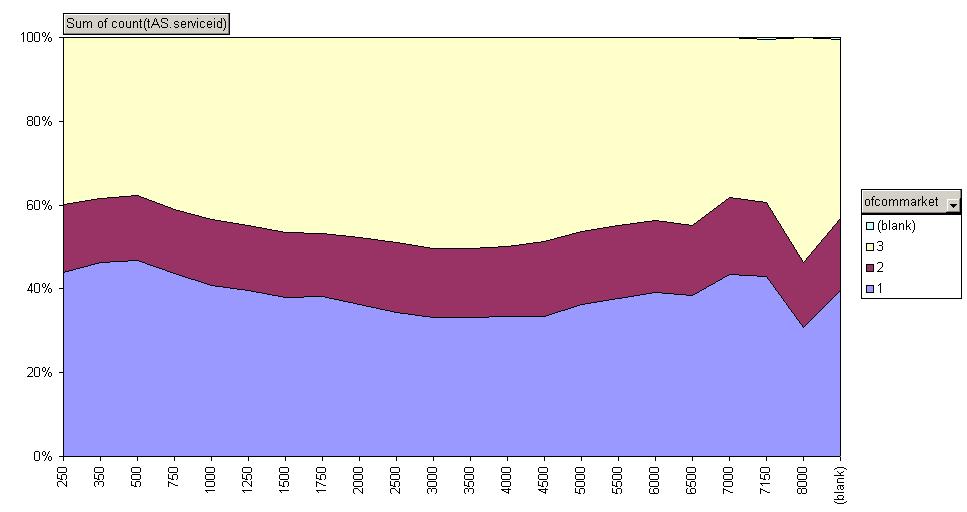
As you can see there are a couple of patterns, the market 1 lines have a noticably higher proportion of lines with lower speeds, probably because of rural nature where the line lengths to properties outside the towns and villages are very long. Market 3 has a lot more lines in the middling speed areas, what you'd probably expect from urban areas where line lengths aren't as long as the rural runs. Market 1 does catch up again with some of the faster lines, again likely because of a lot of people in small towns and villages living very close to the exchange.
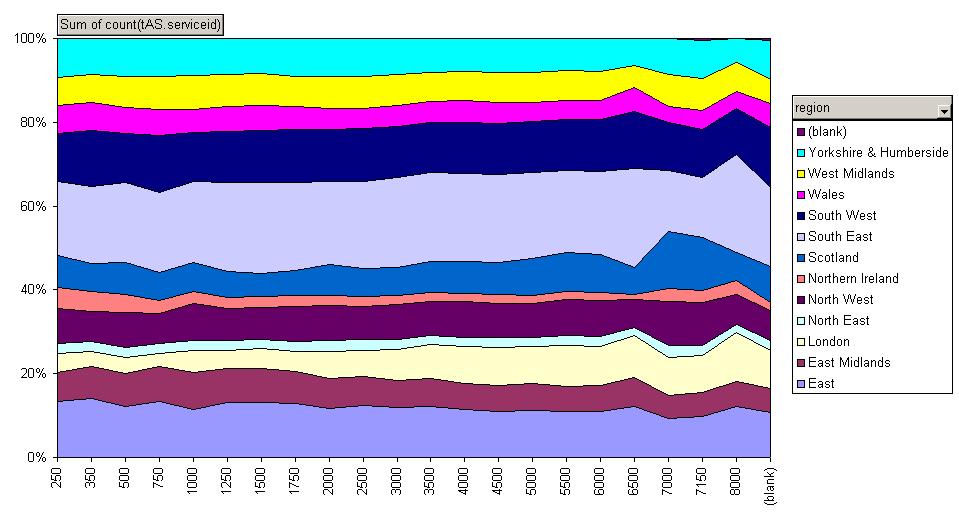
Finally we have a graph of the speeds by region, as you can see places like London and Scotland have higher percentages of faster speeds while some of the more rural areas have slightly more lower speeds but generally the regions are relatively flat.
Dave Tomlinson
Plusnet Network Transformation
